
Gold Producers report record quarters
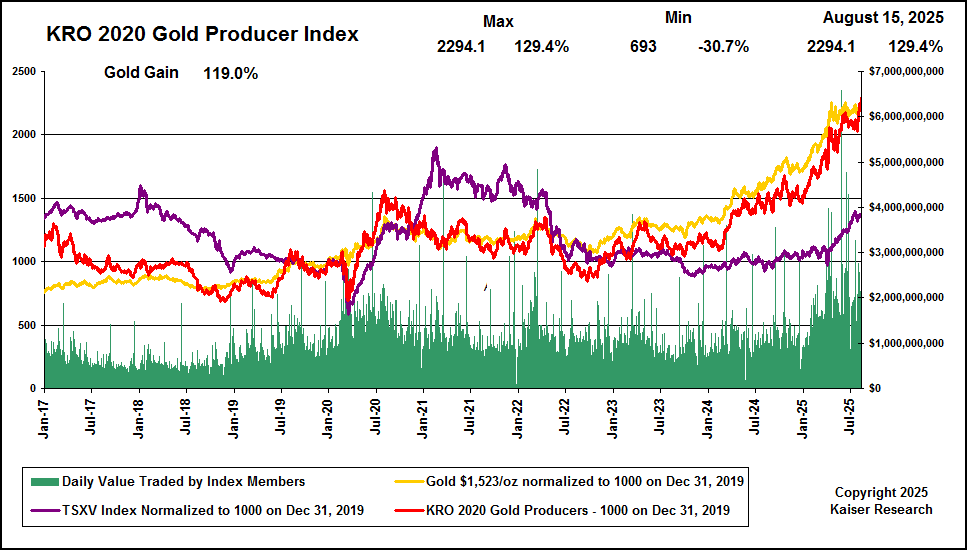
KRO Gold Producer Index finally breaks through gold trend line

During the last few weeks gold producers have reported financial results for Q2 of 2025, at least those which have a typical December 31 year end. I have gone through all the reports and compiled basic information for Q2 results which includes cash flow, number of gold ounces produced, and the average gold selling price. In the recent interview by Bill Powers for MiningStockEducation he asked why I do not focus on gold mining companies and try to pick winners. I do not cover producing gold companies in any detail because my focus is on the exploration and development juniors which these days are a weakly covered sector and also offer the most explosive upside potential. There are many mining analysts working for brokerage firms collecting six figure salaries who specialize in the gold mining sector which has only about four dozen companies. These are competent analysts applying standard valuation methods whose outcome ends up shares in the industry which makes the consensus price of gold mining companies quite efficient. I could spend all my time analyzing the gold producers and come up with a conclusion not much different from that of all the high paid analysts. There simply is nothing of value I could add. Bob Bishop, who retired as a successful and respected newsletter writer in 2007, wrote the Gold Mining Stock Report whose pages not once featured a gold mining company. Bob's success resided in picking winners among exploration and development juniors, and that is where I dare to pretend I have expertise, because the capitalizations of these companies are too low to justify the attention of big shot mining analysts, and consequently their markets are very inefficient.
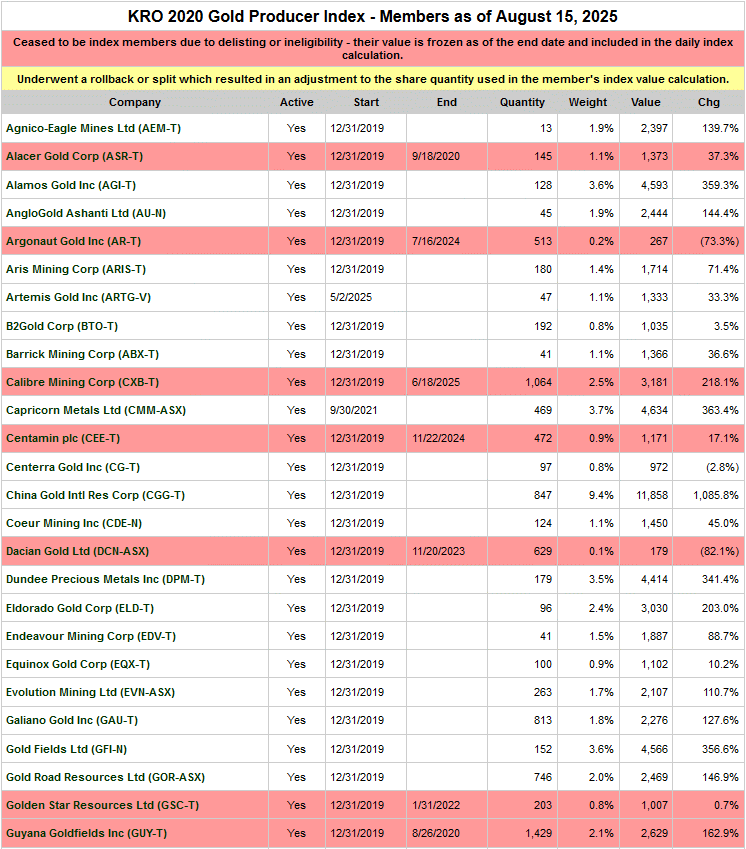
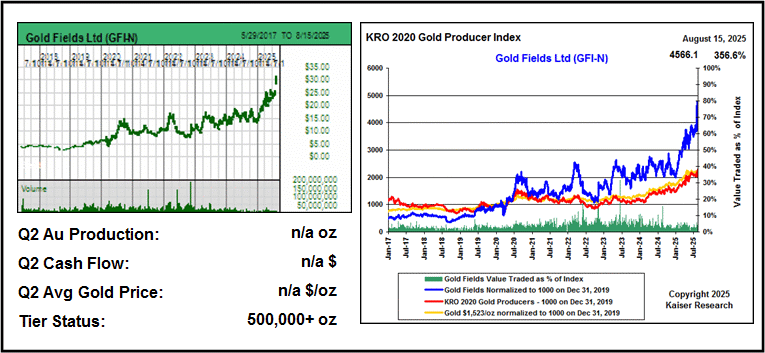
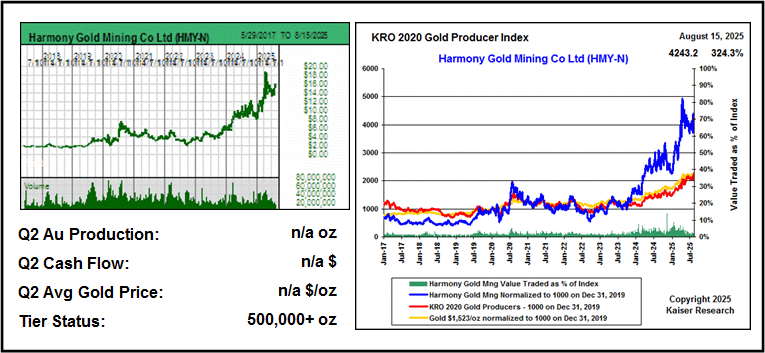
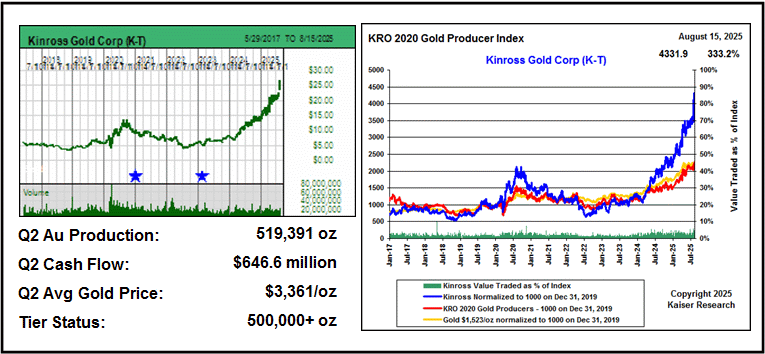
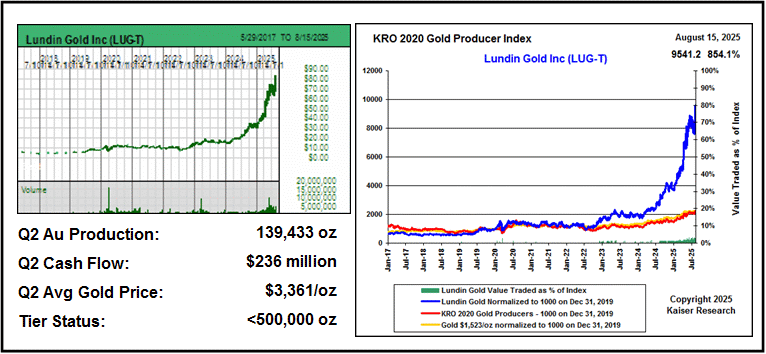
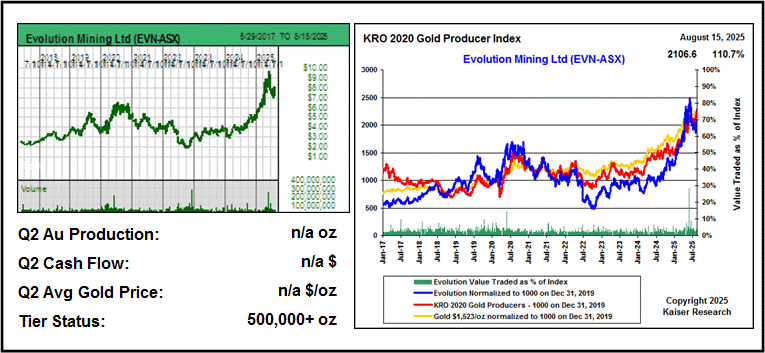
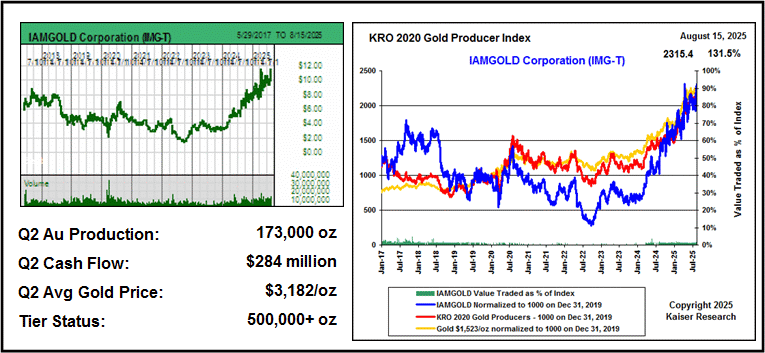
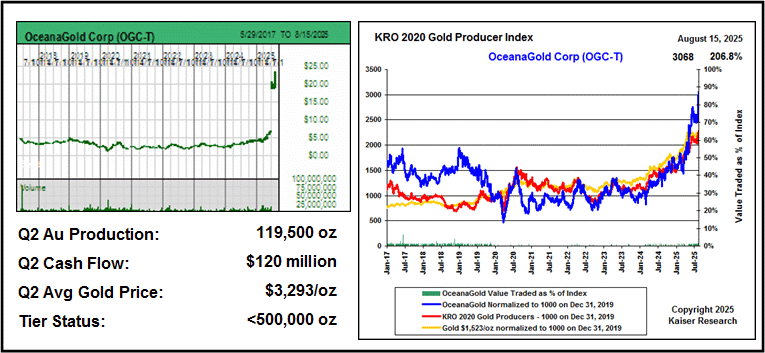
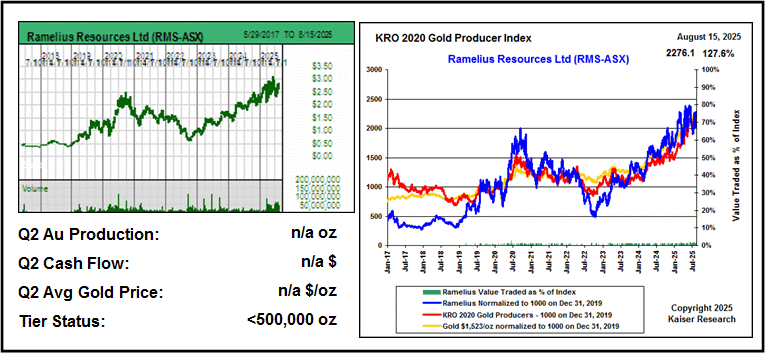
That does not mean I ignore gold producers, which I track in a general manner because they are the potential buyers of juniors with a major discovery or an advanced gold project. So that I can see how the producers are trading as a group and individual producers relative to each other and the price of gold, I created the 2020 Gold Producer Index based on closing gold and company prices at the end of 2019. To qualify a company had to produce at least 100,000 gold ounces annually (no gold equivalent ounces). It was equal weighted with $1,000 of each purchased at the prices as of December 31, 2019. Since then 17 index members have disappeared, mostly through acquisition by other producers though there was one defunct delisting. There have been only 3 new additions. Today there are only 38 companies in the 2020 Gold Producers Index that trade on Canadian, Australian and American exchanges.
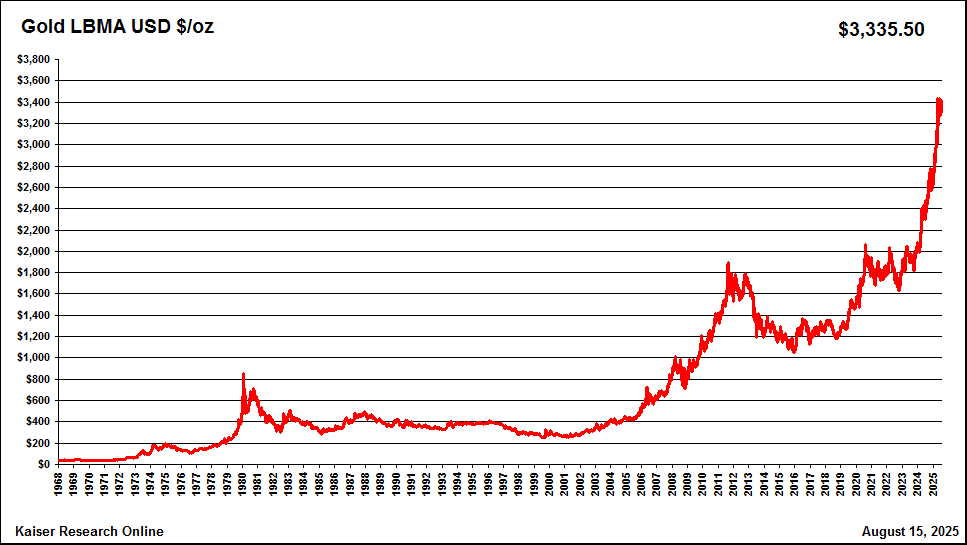
Because I back calculated the index to the start of 2017 I ended up with an 8 year time series which visually captures the loss by the gold producers of the premium pricing they enjoyed as leveraged proxies for the price of gold, something not enjoyed by their base metal producer peers. The premium pricing emerged during the 1970s after gold's peg to the US dollar at $35 per ounce was ended. Gold's rapid rise to a peak of $850 in 1980 before settling back to the $400 level inspired predictions of imminent $2,000 by people like Doug Casey and the Aden sisters premised on warnings that American fiscal policy amounted to fiat currency debasement. Gold ranged between $350-$450 for the next two decades which culminated in central bank gold reserve liquidation that dropped gold as low as $256 in 1999. Despite the discreditation of the gold bug mantra the premium pricing persisted and was rewarded during the 2000s when gold developed an uptrend that peaked in late 2011 before settling back into the $1,000-$1,400 range.
A flurry of M&A while gold bounced between $1,500-$2,000 during 2010-2012 subsequently ended up eroding the premium pricing advantage of gold producers as mining sector cost inflation collided with lower than expected gold prices, resulting in development cost overruns and lower projected revenue. The market was pissed. When the covid panic of 2020 pushed gold briefly above $2,000 premium pricing reasserted itself but faded when gold retreated back below $2,000. When the Russian invasion of Ukraine in 2022 pushed gold again above $2,000 the Gold Producer Index merely tracked the gold price trend, and when that gold rally quickly failed, despite the far-reaching geopolitical implications of Putin's actions and China's decision to form a Global East alliance with Russia squared off against the democracy based Global West, the market soured on gold producers as a leveraged gold price proxy. Since then, until the Q2 2025 earnings reports starting in late July, the Gold Producer Index has tracked but underperformed the gold price index.
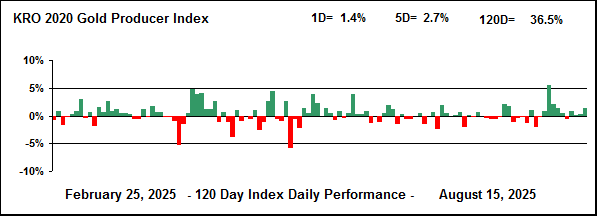
During the past week when the last of the gold producers reported their Q2 results the Gold Producer Index finally surged above the gold trend line so that it is now up 129.4% from the start of 2020 compared to 119% for gold. During the last 10 trading sessions the Gold Producer Index gained in all but one.
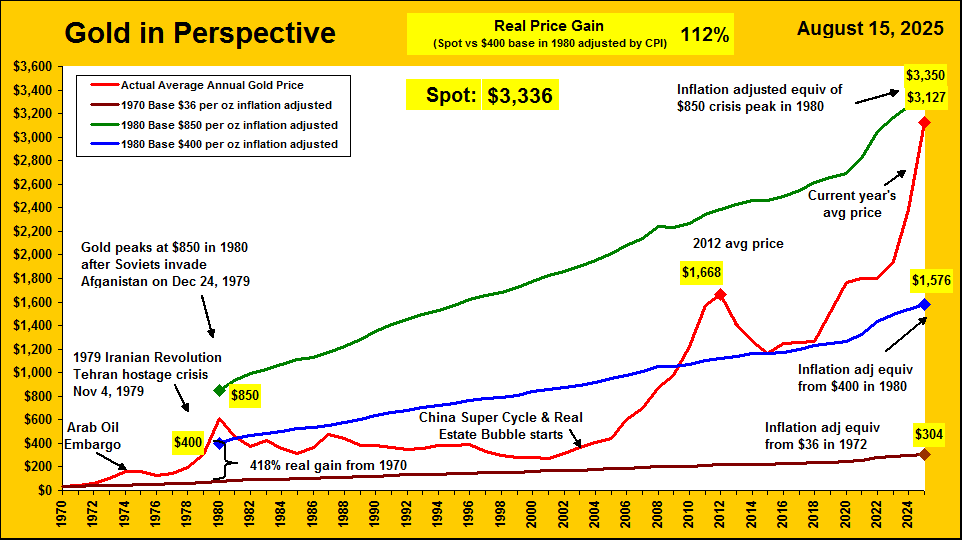
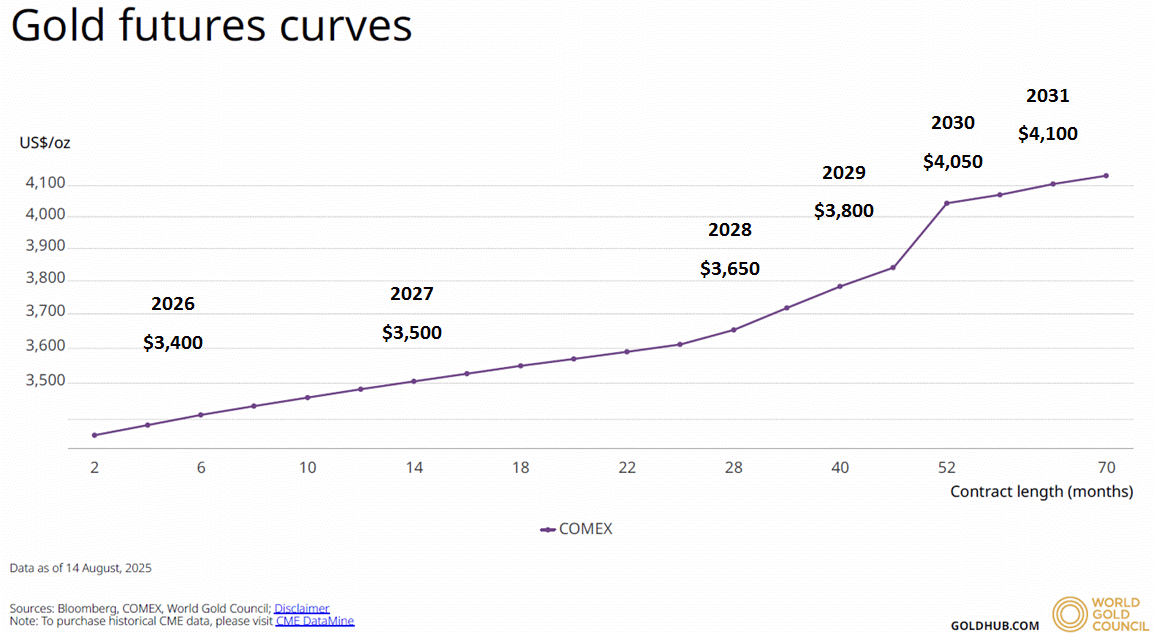
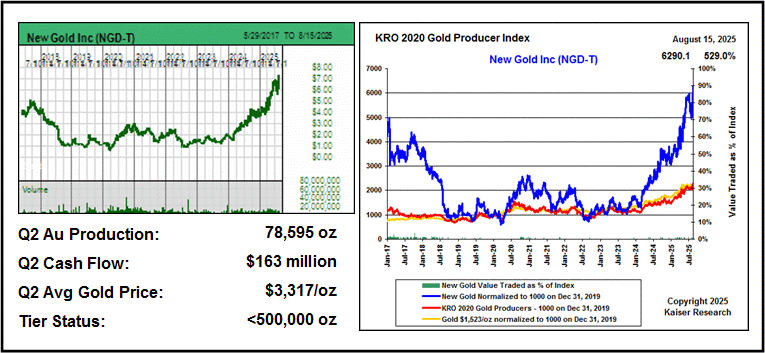
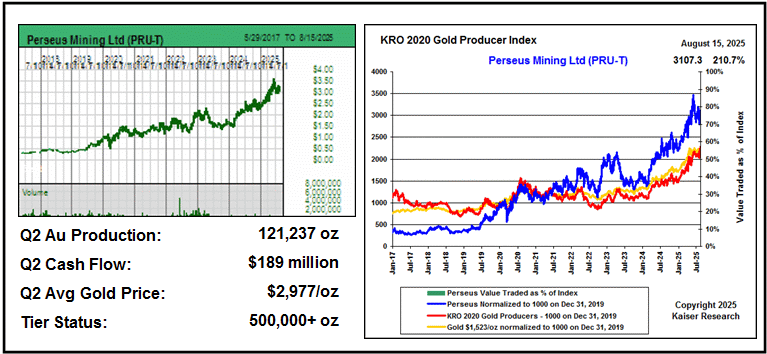
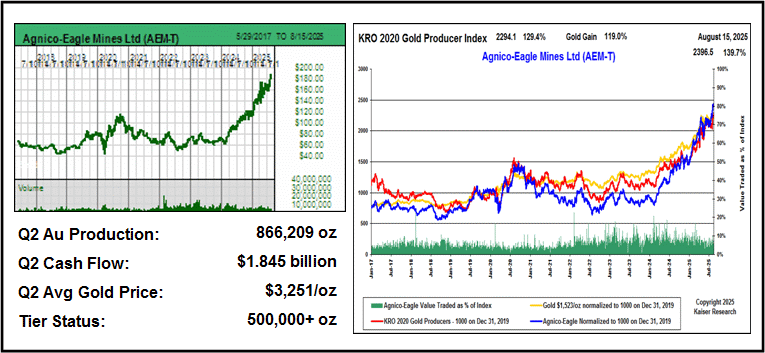
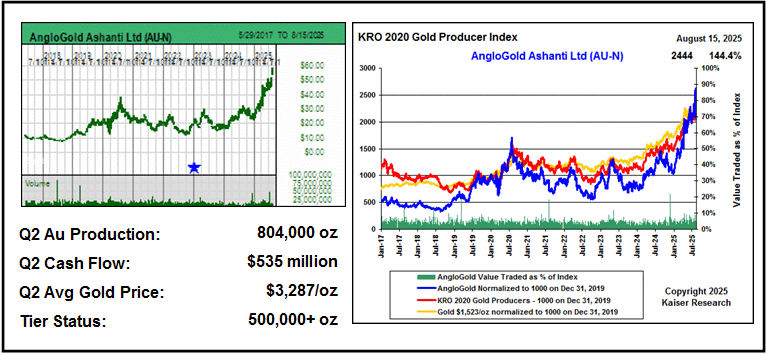
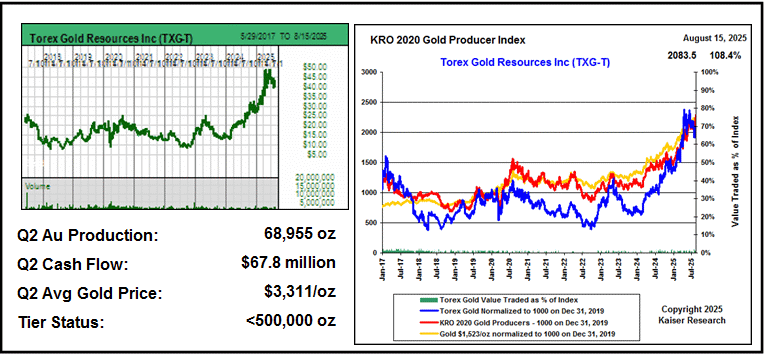
What the market observed was that many of the producers were reporting record cash flow for Q2 and their average selling price for gold was between $3,200-$3,400 per ounce, essentially the spot price during that period. Only one producer, Centerra Gold, managed to average below $3,000, in this case $2,793, thanks to an earlier streaming deal. Gone are the days when cynical producers forward sold gold to keep their skeptical bankers happy. Today they are behaving in the manner the market expected them to behave so as to justify premium pricing as a leveraged proxy for future higher gold prices. The Comex futures curve published by the World Gold Council shows gold gradually increasing to $4,100 by 2031. What the futures curve does not predict is future inflation, simply expectations for the nominal future gold price. My Gold in Perspectives chart shows that spot gold is up 112% in real price terms if you inflation adjust $400 gold in 1980 to the present.
The big question now is whether the elevated gold price reflects future inflation, or an uncertainty premium reflecting America's forfeiture of its role as the leader of the Global West? The Q2 reporting window created the basis for a perceptual inflection on this question. As we head into the September gold conference month we may see the market accept that gold is undergoing a fundamental repricing similar to what it did during the seventies, though on a more modest scale. This would result in more and more gold producers outperforming gold with the 2020 Gold Producer Index representing 38 companies producing at least 100,000 ounces gold annually shooting well above the gold trend. If this does indeed happen, it will initially have a massive impact on advanced gold juniors such as Vista Gold Corp, which will eventually trickle down into big anticipation premiums for exploration juniors such as KRO Favorites Arizona Gold & Silver Inc and Solitario Resources Corp. The next four months could be the most exciting period in a decade for speculators who love resource juniors.
It is not my job to tell you which gold producers are the best ones, which is a dubious criterion anyways because the producers recognized as the best companies will already be priced accordingly. Much more interesting will be the producers who until recently merely tracked the gold trend. And the biggest potential upside lies with those producers who have been laggards, not because management is hopelessly incompetent, but rather because they have suffered mining accidents and been punished. The KRO 2020 Gold Producer Index has a page within Kaiser Research Online that features the index and all its components and which gets updated daily. This makes it easy for KRO members to monitor the gold producers and do their own research to discover future performance potential.
I do not try to predict that. I am just interested in keeping track of which producers are getting stronger and ever more willing to shift into acquiring pre-production juniors. And to what extent the entire group is getting stronger. The big thing to understand is that for now the market still thinks gold is in a price bubble and the producers are enjoying a cash flow windfall that will soon enough vanish. That is why the market is still hesitant to pile into the gold juniors in the Favorites Collection. The rest of this Kaiser Watch episode will simply show who the gold producers are and how they have performed. I present them as three alphabetically groups: those that have outperformed gold during the past 2 years, those that have underperformed gold but tracked its trend and which are now showing signs of outperforming gold, and the laggards who have underperformed gold during the past couple years.
Gold Producers that have outperformed gold during the past two years
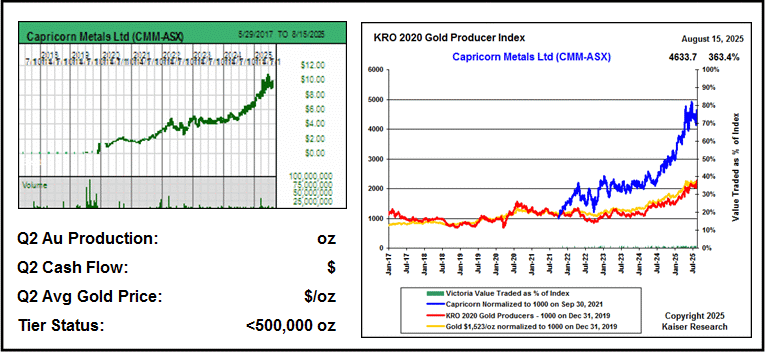
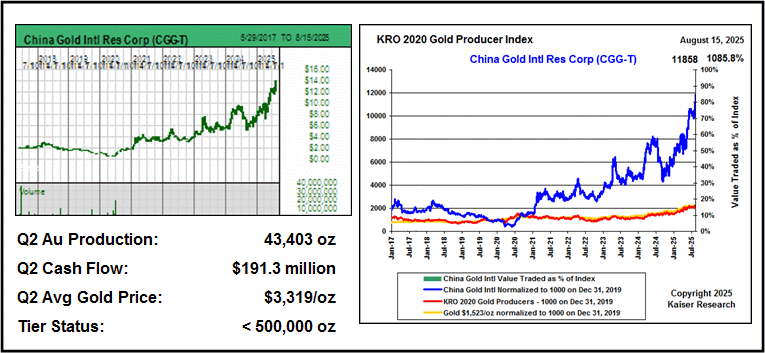
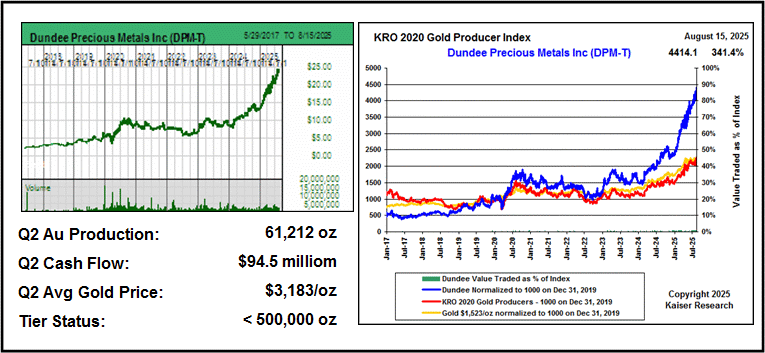
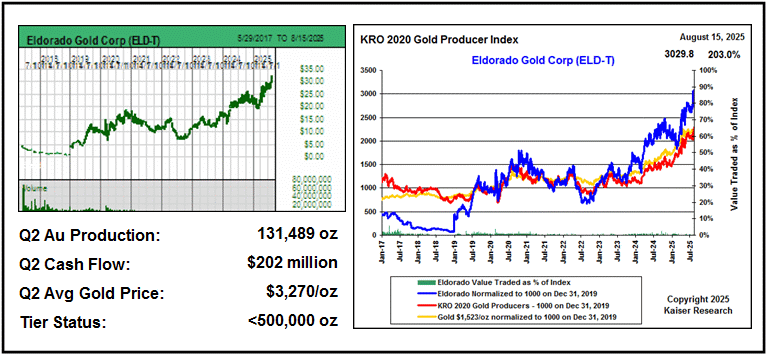
Gold Producers that have tracked but underperformed gold during the past two years
Gold Producers that have underperformed gold during the past two years
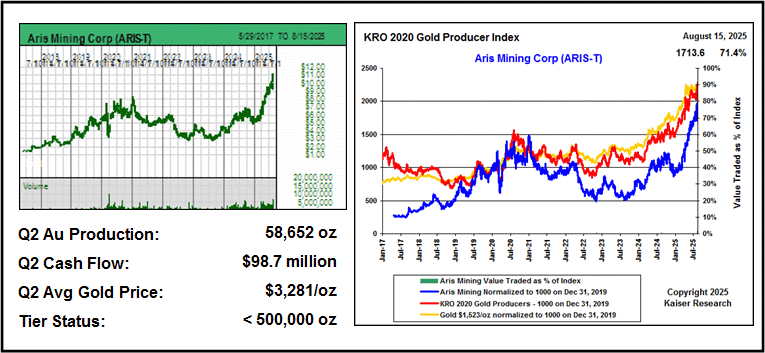
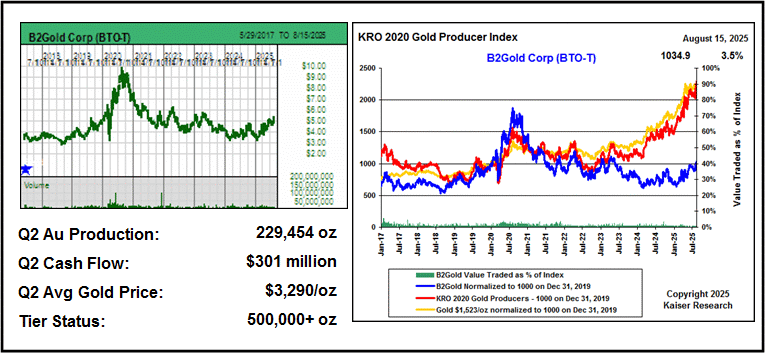
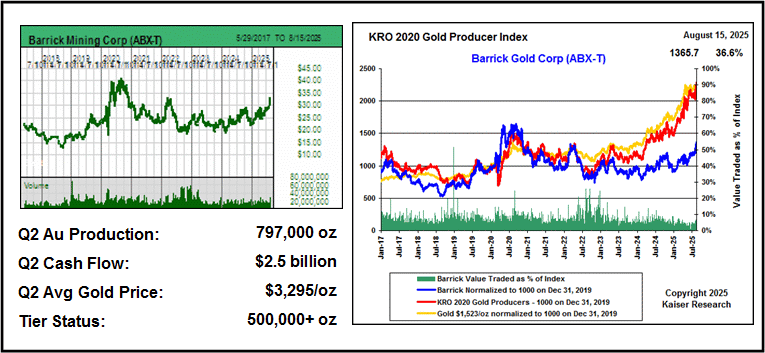
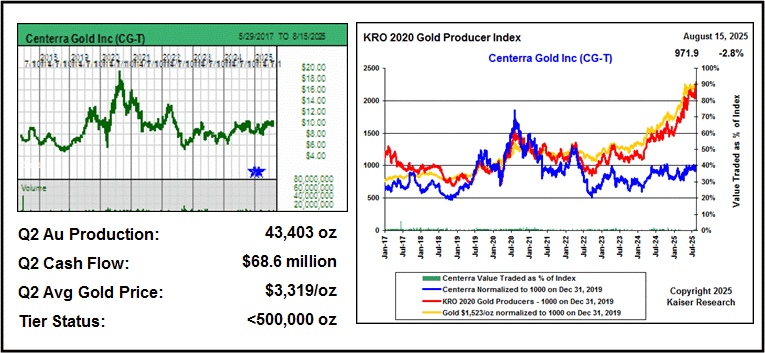
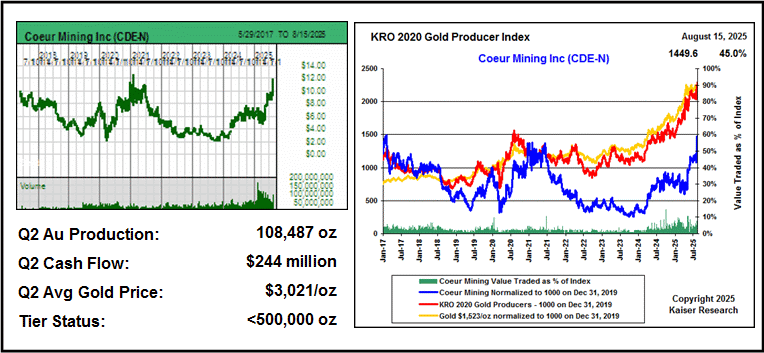
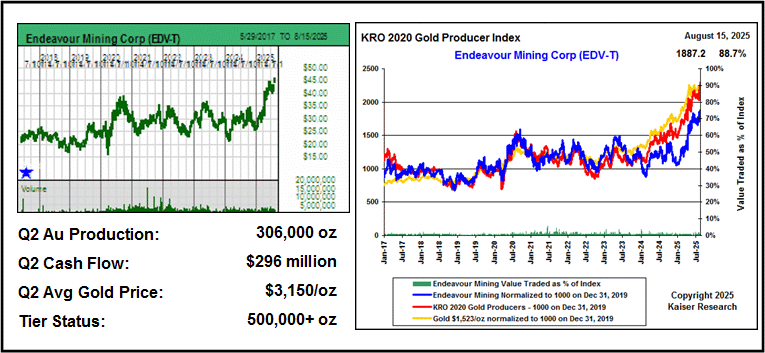

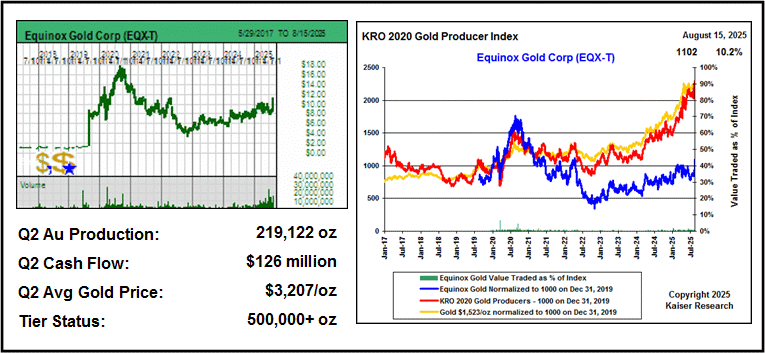
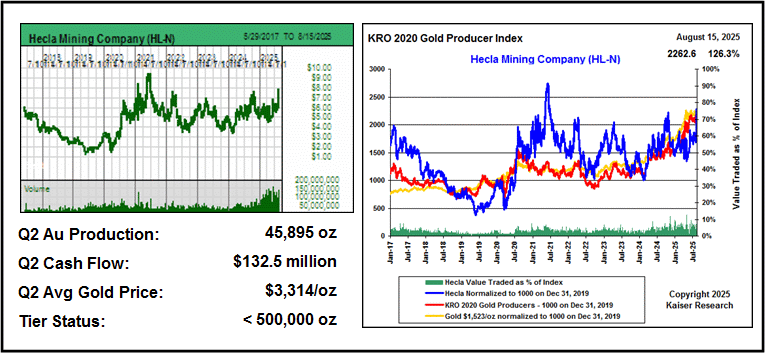
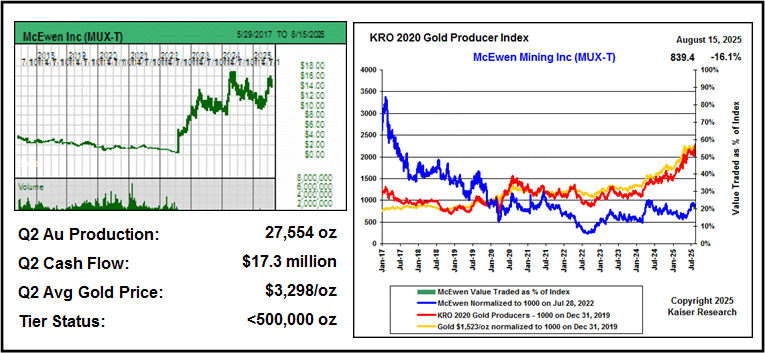
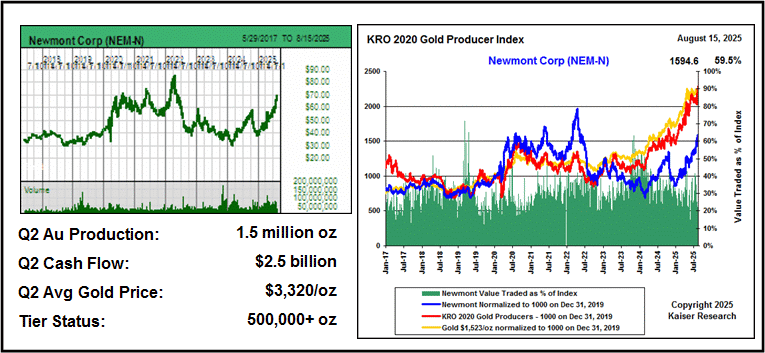
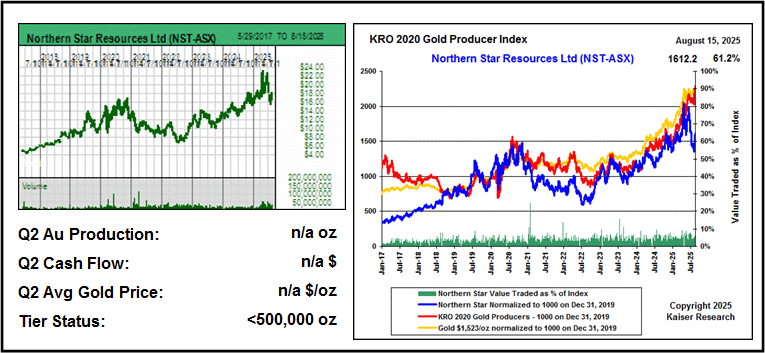
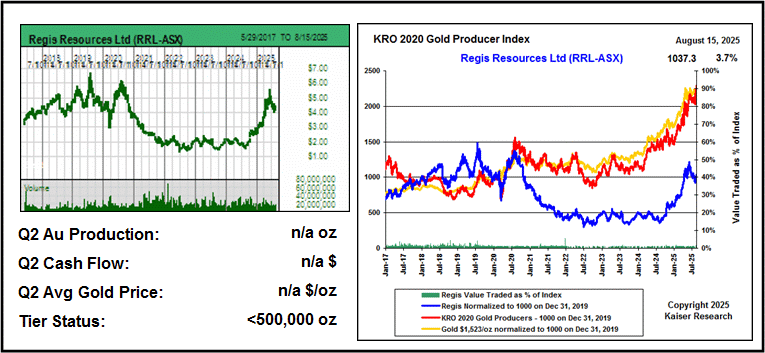
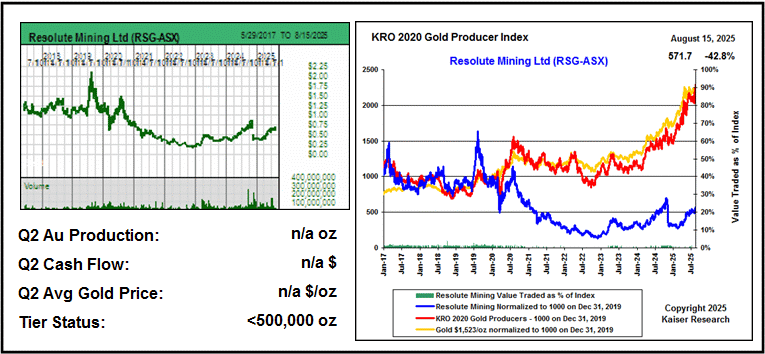
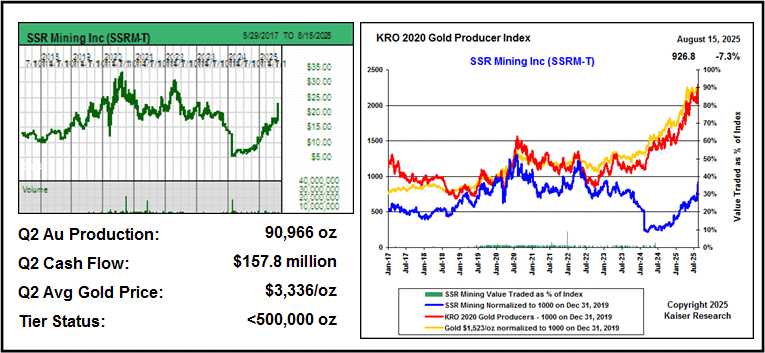
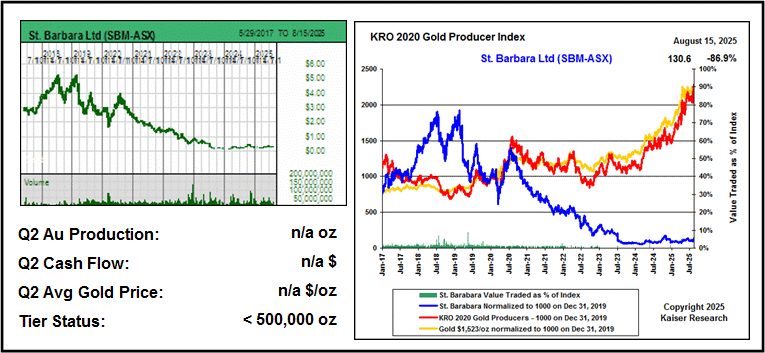
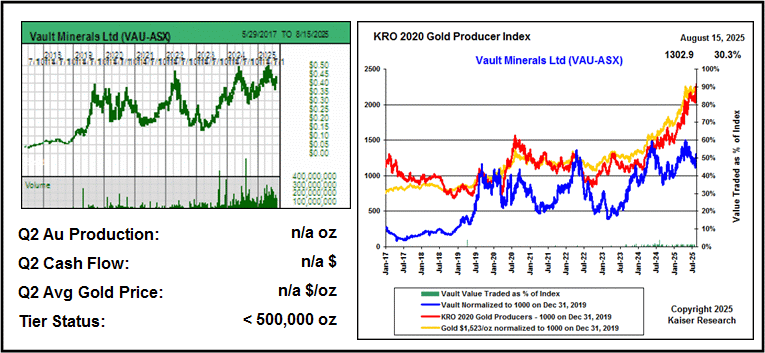
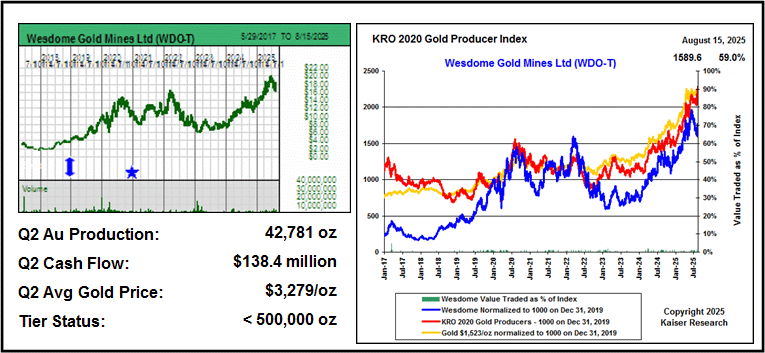
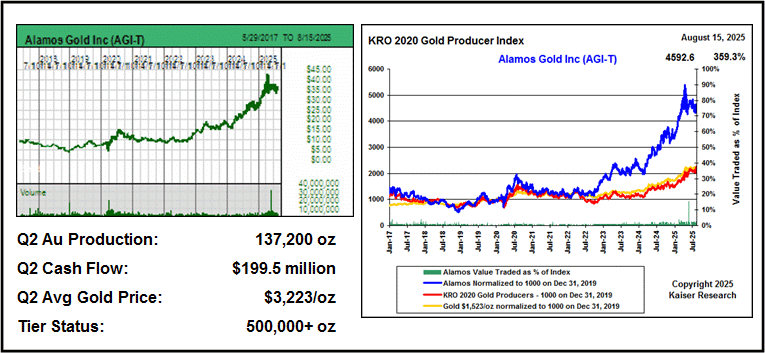
The companies which have no Q2 data are ones with a different reporting cycle such as ASX listed producers. The value of the above set of charts is that each gold producer's own index allows us to see how they have performed compared to their peer group.